GeForce RTX vs. 3DMark
3DMark is a popular computer benchmarking tool targeting 3D graphics and CPU performance. It produces a normalised score (higher is better) for comparing different PC hardware configurations.
I joined the 3DMark community (known then as MadOnion) in 2000, just after the launch of 3DMark2000. My small claim to fame, in 2002, I gained early access to an NVIDIA GeForce Ti 4600, which I modified with a custom cooler and voltmod. This resulted in a short period near the top of the 3DMark2001 SE global leaderboard.
Earlier this month, I gained access to an NVIDIA GeForce RTX 2080 Ti. As part of my testing, I thought I would take a trip down memory lane, running all compatible versions of 3DMark.
Introduction
As outlined in the article “my setup”, the GeForce RTX 2080 Ti was added to my custom-built PC. The full specification can be found below:
- Asus Maximus VIII Hero Alpha (Intel Z170)
- Intel Core i7-6700K 4.0GHz @ 4.6GHz
- Noctua NH-D15 CPU Cooler
- Corsair Vengeance LPX 32GB DDR4 PC4-24000C15 (15-17-17-35)
- PNY GeForce RTX 2080 Ti 11GB XLR8 Gaming Overclocked Edition
- Samsung 950 Pro 512GB M.2 PCI-e NVMe SSD
- EVGA SuperNova P2 1000W ‘80 Plus Platinum’ PSU
- Phanteks Enthoo Evolv ATX Mid Tower Case
NOTE: The GeForce RTX 2080 TI is obviously not optimised to run legacy benchmarks. Therefore, these results are for reference only and should not be used to compare hardware.
3DMark (2013 to 2018)
3DMark is a DirectX 12 benchmark for Windows 10, supporting multi-core processors and 4K resolution. 3DMark is the only fully supported benchmark, therefore the result below can be used for comparison.
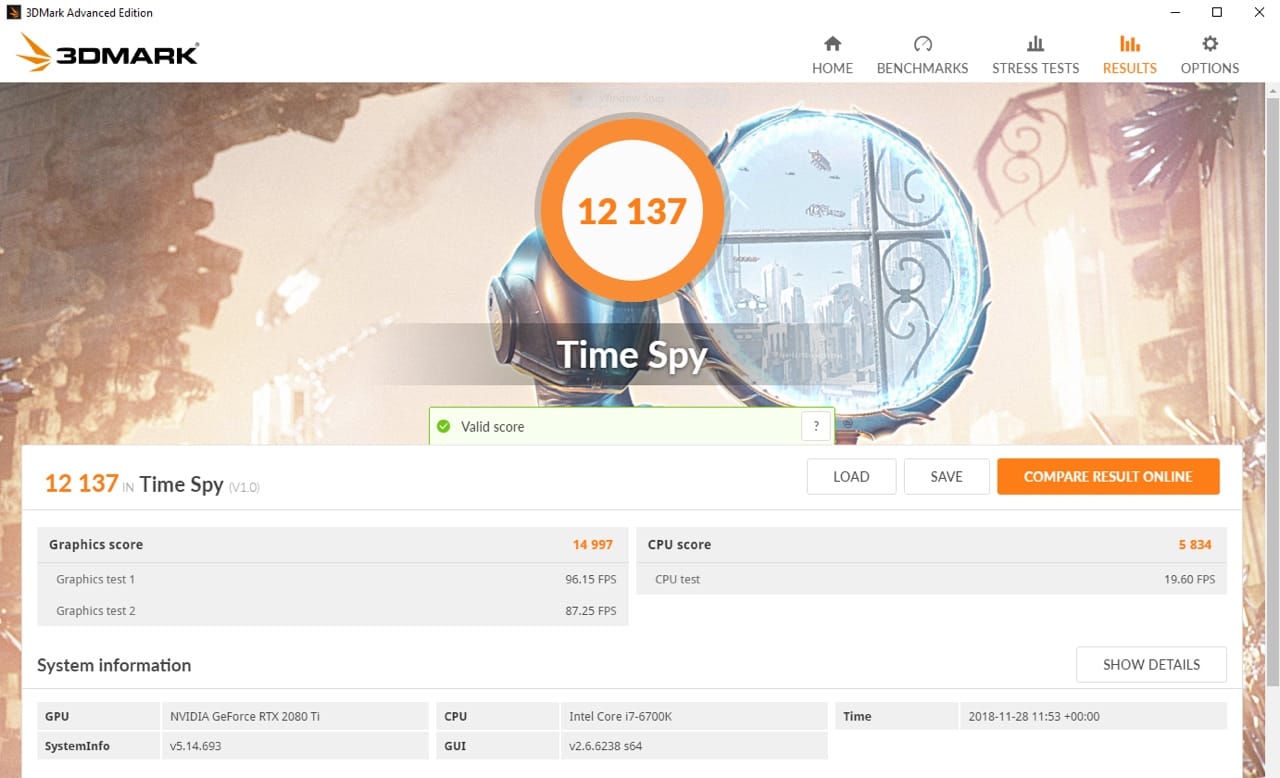
3DMark will be updated in January 2019 to include a ray-tracing benchmark, allowing for more thorough testing of the GeForce RTX series. This new suite of tests will become increasingly important as ray tracing and hybrid rendering (ray tracing + rasterisation) matures.
3DMark 11
3DMark 11 is a DirectX 11 benchmark, including features such as tessellation, compute shaders and multi-threading.
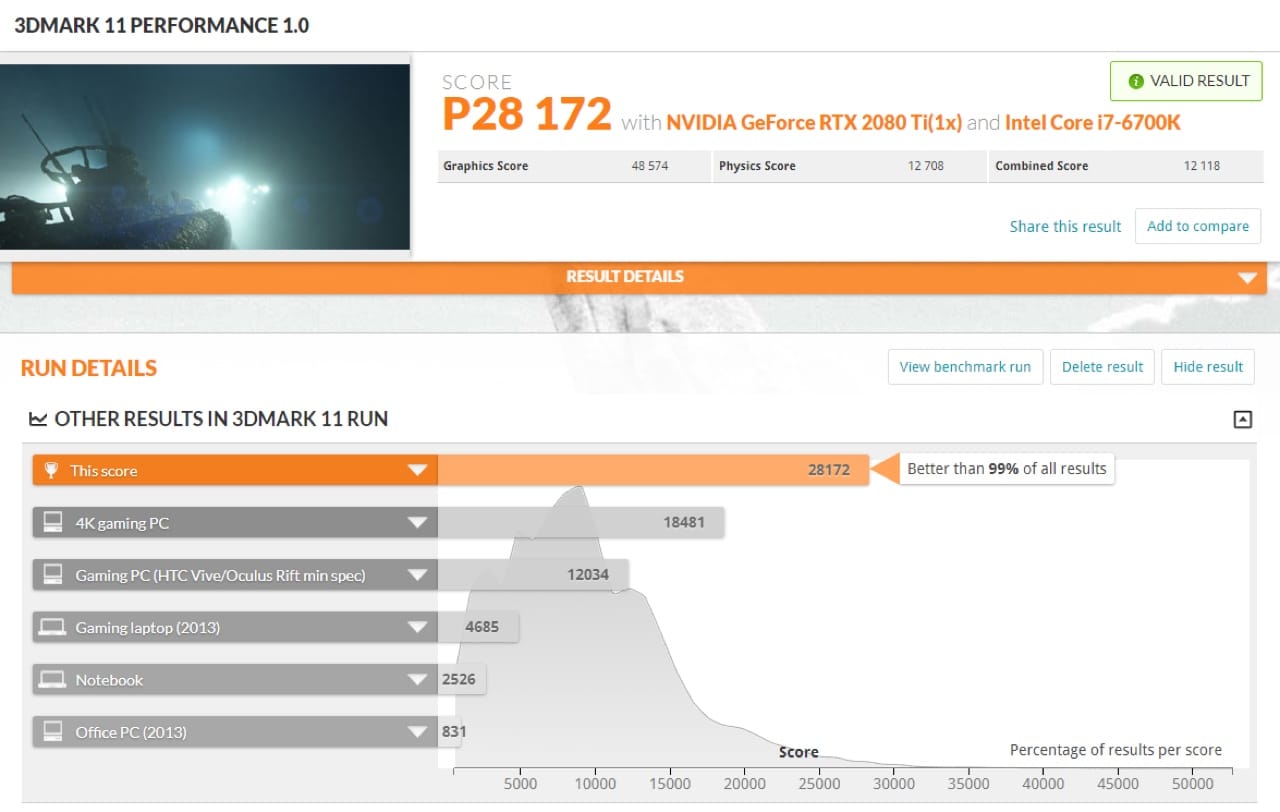
As a relatively modern benchmark, the GeForce RTX 2080 Ti produces an impressive result. By comparison, in 2016 my GeForce GTX 980 achieved a score of P18063.
3DMark Vantage
3DMark Vantage is a DirectX 10 benchmark for Windows Vista. It includes the Jane Nash and New Calico graphics tests, an AI test, a physics test and six feature tests.
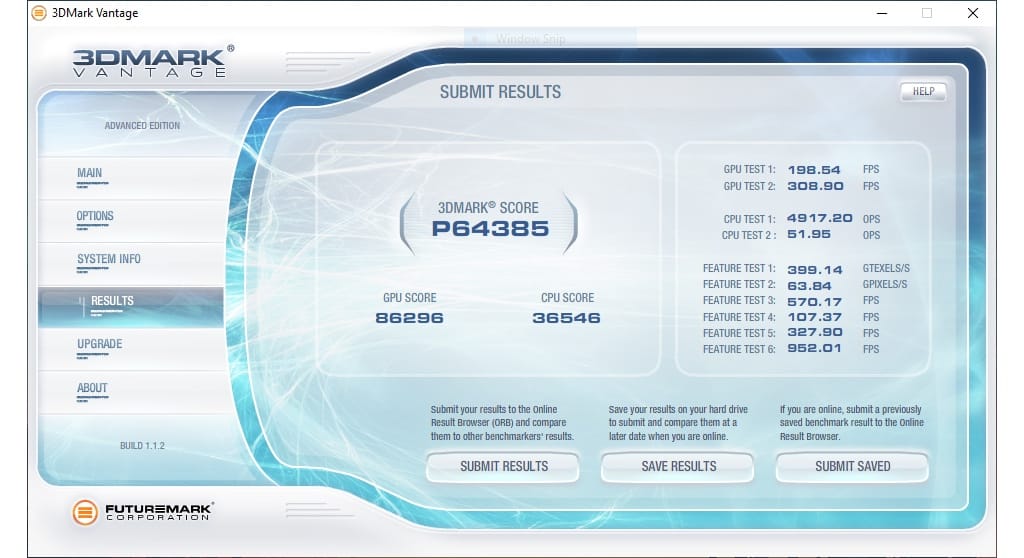
The Jane Nash test achieved an average of 201 FPS, followed by 308 FPS for the New Calico test.
3DMark06
3DMark06 is a DirectX 9.0c benchmark, adding support for Shader Model 3.0 and new CPU tests using PhysX. The graphics tests are Return to Proxycon, Firefly Forest, Canyon Flight, and Deep Freeze.
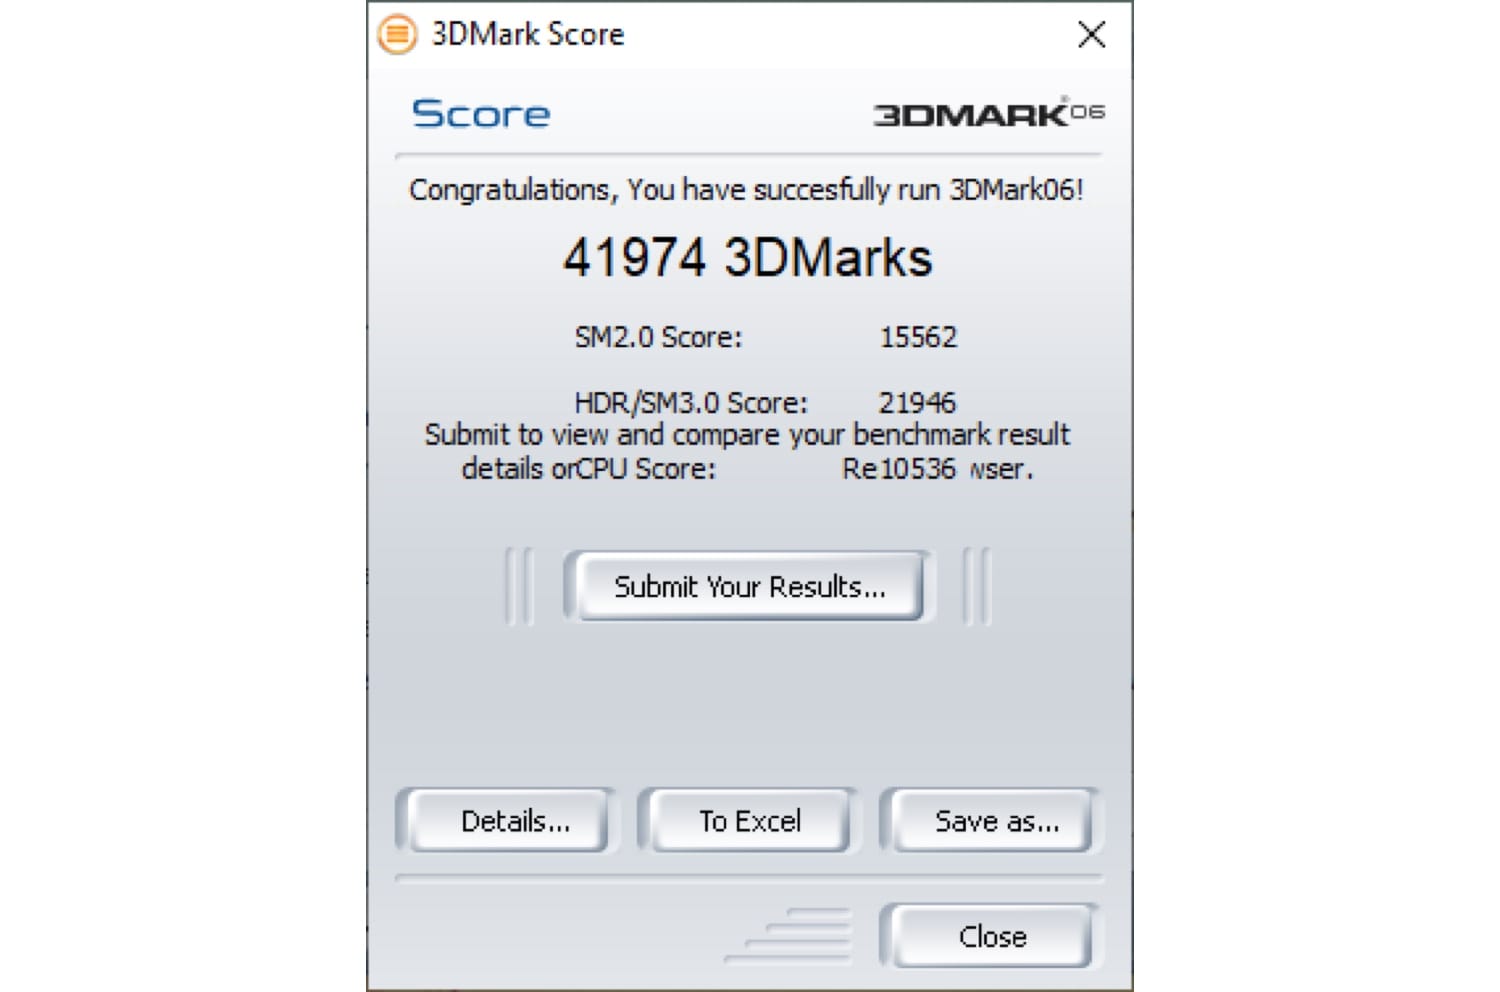
The GeForce RTX made short work of the game tests, hitting an average of 128 FPS in Return to Proxycon and 275 FPS in Canyon Flight. Even though the benchmark is over a decade old, the CPU tests remain incredibly intensive, with my quad-core/eight-thread Intel i7 only achieving an average of 5 FPS.
3DMark05
3DMark05 is a DirectX 9.0c benchmark, providing support for Shader Model 2.0. Game tests include Return to Proxycon, Firefly Forest and Canyon Flight.
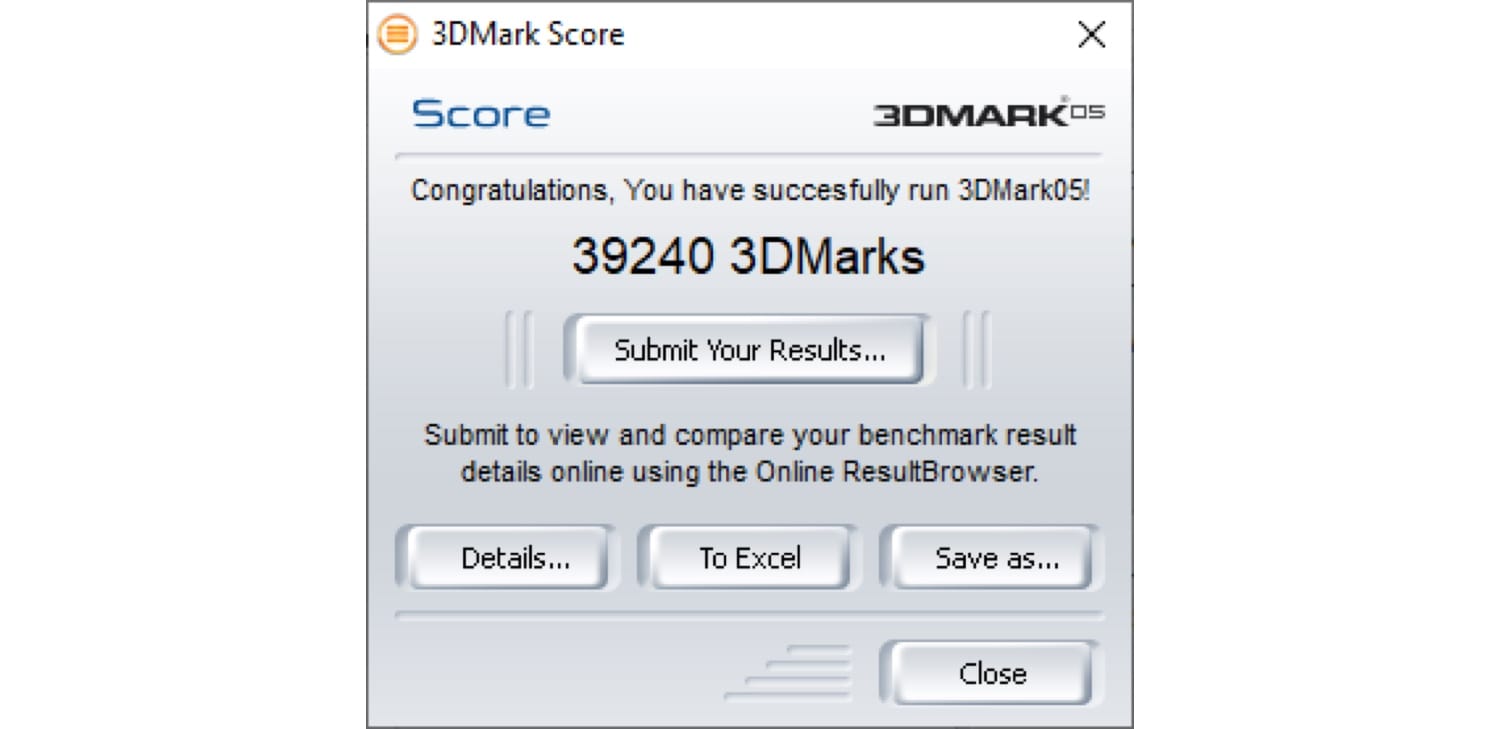
The Return to Proxycon test achieved an average of 146 FPS, with Canyon Flight averaging 320 FPS. Interestingly, the CPU tests in 3DMark05 performed worse than 3DMark06, achieving an average of 1.3 FPS.
3DMark03
3DMark03 is a DirectX 9 benchmark. It was the first 3DMark to include CPU tests. The graphics tests are Wings of Fury, Battle of Proxycon, Troll’s Lair and Mother Nature.
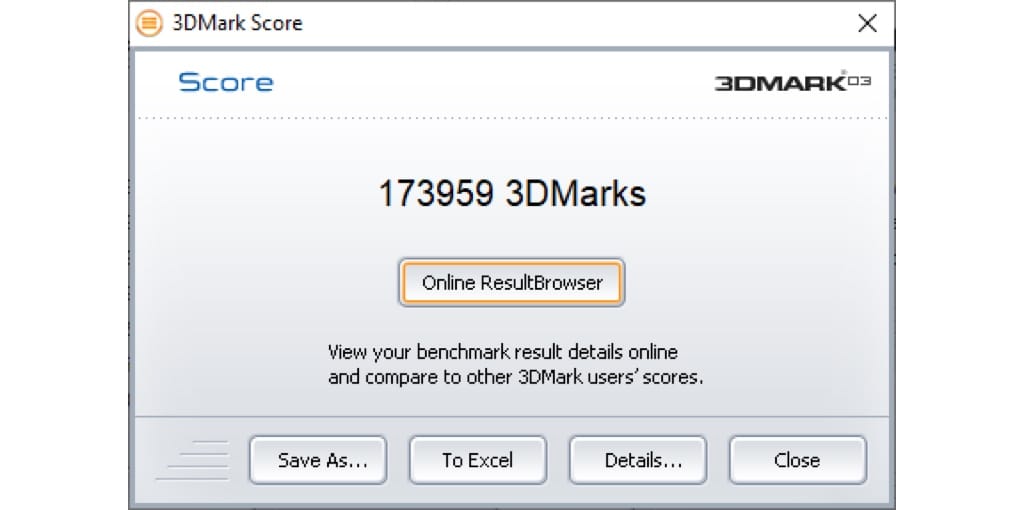
It was impressive to see Battle of Proxycon hit an average of 1462 FPS and the Pixel Shader 2.0 performance exceed 3300 FPS. Based on the numbers, 3DMark03 game tests resulted in the highest overall performance.
3DMark2001 SE
3DMark2001 SE is a DirectX 8.1 benchmark. The Car Chase, Dragothic, Lobby, and Nature tests feature vertex and pixel shaders and full scene anti-aliasing.
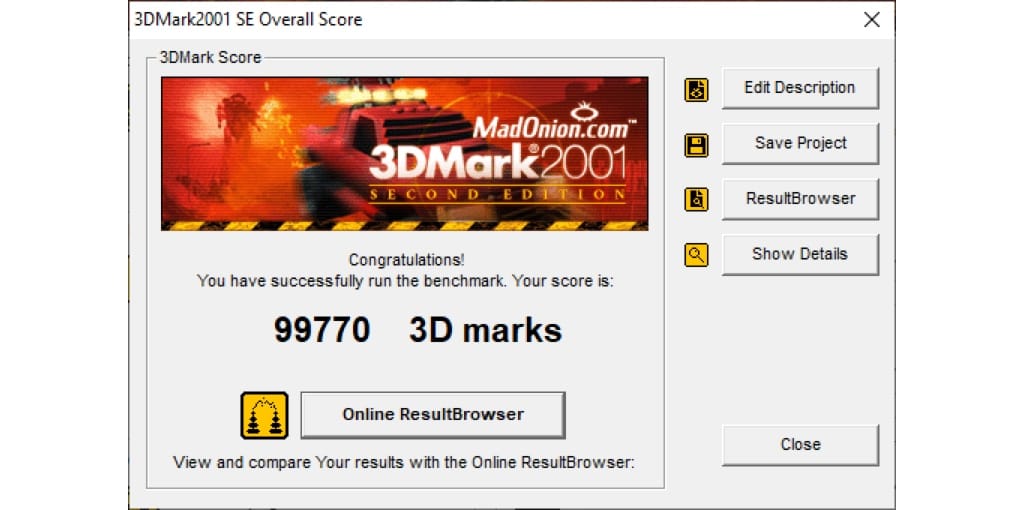
The user interface of 3DMark2001 SE is restricted to 999 FPS, therefore it is more difficult to understand the true performance. However, using FRAPS revealed and an average of 1300 FPS for the opening three (low detail) graphics tests.
Conclusion
I was also able to run 3DMark2000 (DirectX 7.0), however, this required “Windows XP Compatibility Mode” to be enabled, as well as a modified “SystemInfo.dll”. Although the benchmark did run clean, the score was drastically low (4295), clearly highlighting the impact of unoptimised hardware/software.
As a long-time user of 3DMark, it was fun to watch the GeForce RTX 2080 Ti tackle these legacy benchmarks. It was also surprising how well all of the benchmarks performed, considering the lack of support and optimisation.