Cybersecurity Dashboard
In May, my role was expanded to include Chief Information Security Officer (CISO).
A key responsibility is to represent cybersecurity as part of the Executive Committee and Board of Directors, covering the strategic direction, maturity, risks, incident management, awareness and education.
This has become increasingly important over the past year, with proposed rules from the SEC to enhance and standardise the disclosure of cybersecurity risk management, strategy, governance, and incident reporting by public companies.
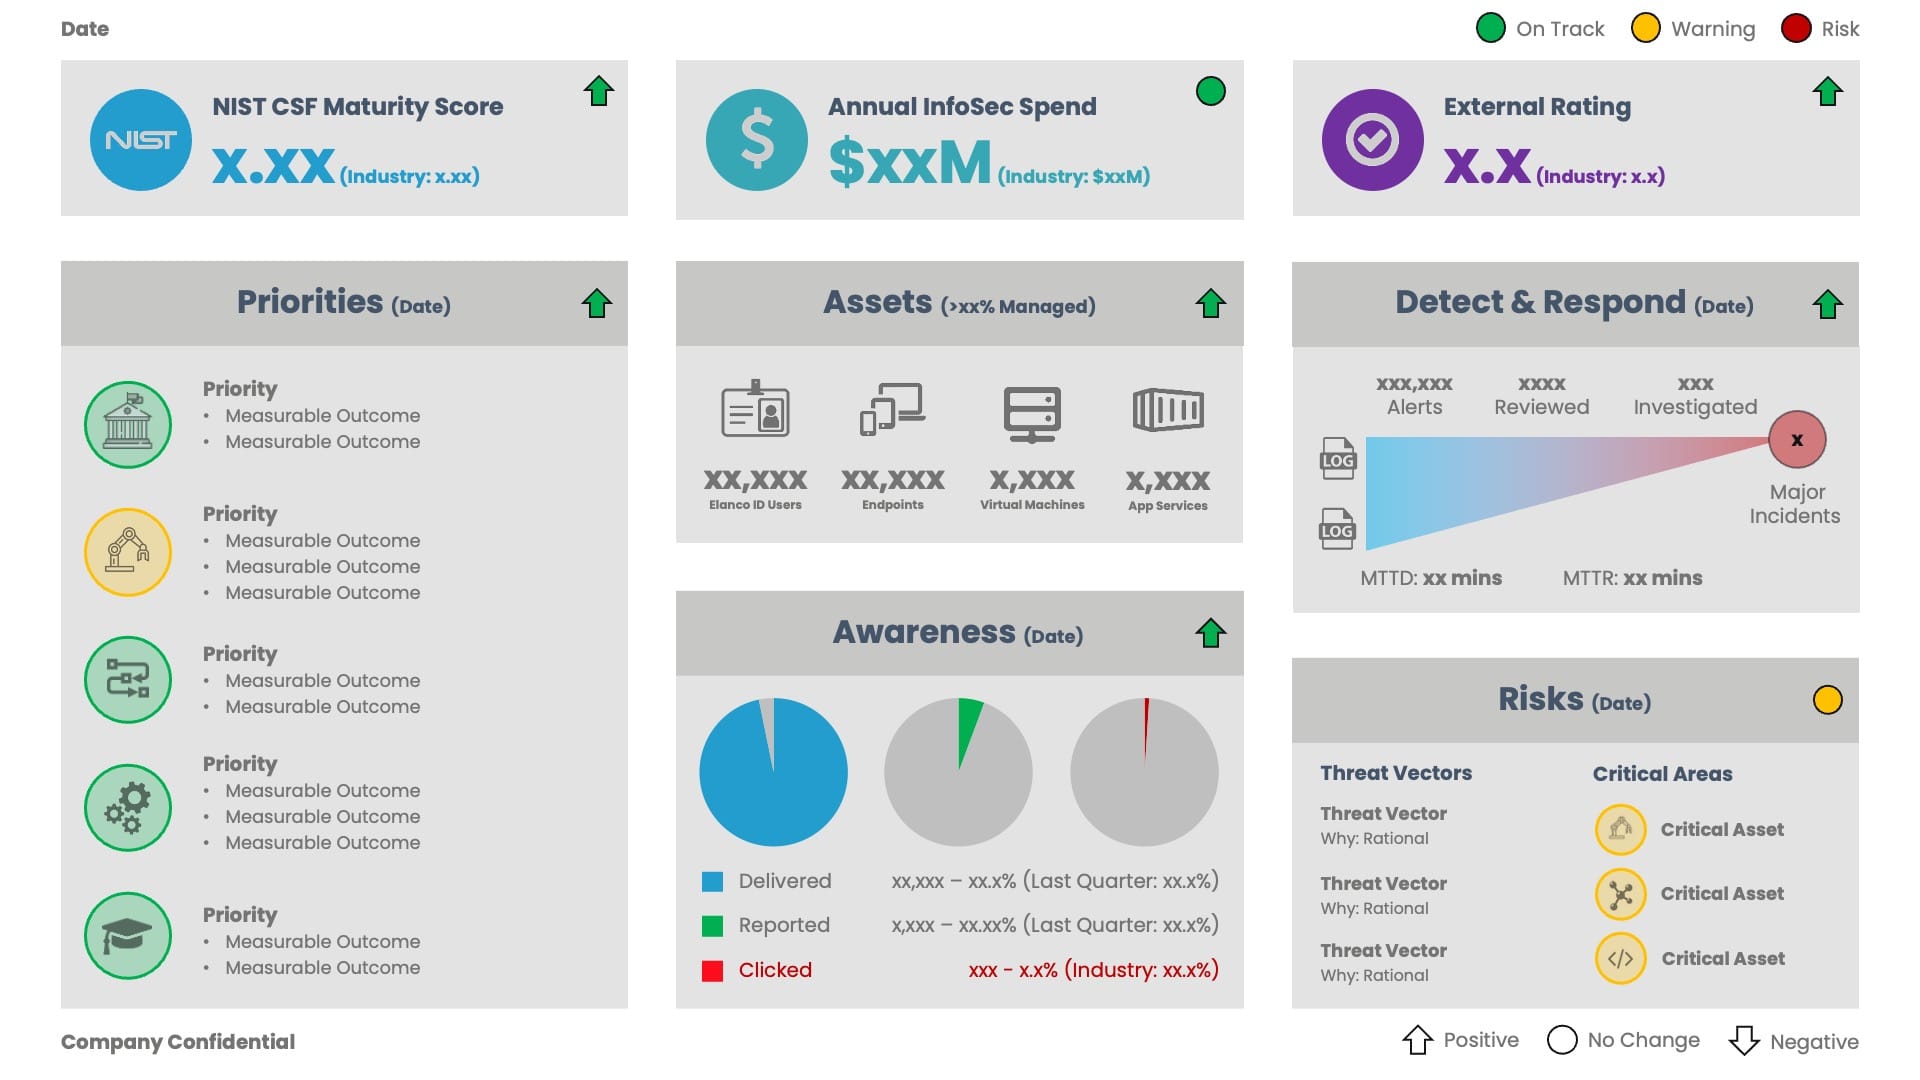
To support this outcome, each quarter, I present a standard dashboard to help facilitate the discussion. In the spirit of transparency and collaboration, I thought I would share the dashboard template.
The dashboard includes eight sections, highlighting (and wherever possible, quantifying) key metrics associated with cybersecurity.
The sections were selected based on their relevance to the business. Therefore, if you plan to reuse the template, please modify/replace the sections as required.
NIST CSF Maturity Score:
- The NIST Cybersecurity Framework (CSF) is a commonly used set of guidelines for mitigating organisational cybersecurity risks, based on established standards, guidelines, and practices.
- The maturity assessment is scored against the 5 functions of the NIST Cybersecurity Framework (23 categories and 108 subcategories). Scoring is between 1 (No Control) and 5 (Enforced/Automated at Scale).
- The industry score highlights the industry average score. If the industry average score is not known, the target score would be a good replacement.
Annual InfoSec Spend:
- The total spend for Information Security includes direct (Infomation Security budget), indirect (other budgets) and people (FTE/Contractor).
- The industry spend highlights the industry average, which for enterprise businesses is commonly between 7% and 10% of the IT budget (Ernst Young).
External Rating:
- The external cybersecurity rating provides an external perspective from a reputable source, for example, Mastercard. Ideally, the score would incorporate software, infrastructure, geolocation, hosting providers, third parties, domains, systems and configuration.
- External ratings are used to assess the material cybersecurity risk of a business before investments, partnerships, mergers, acquisitions and/or divestitures.
- The industry score highlights the industry average score. If the industry average score is not known, the target score would be a good replacement.
Priorities:
- The top five priorities for Information Security, ideally complimenting the business strategy and mitigating any enterprise and external risks.
- Each priority includes a measurable outcome, ensuring progress can be tracked against a specific deliverable.
Assets:
- The managed IT assets, covering the users (active identities), endpoints (Windows, macOS, iOS, Android), virtual machines (all hosting environments) and application services (SaaS, Serverless, Containers).
- The managed percentage indicates the status of the assets, covering discovery, hardening, patching and advanced threat protection.
Awareness:
- The results of key awareness and education initiatives. For example, a social engineering phishing campaign, highlighting the number of emails successfully “delivered”, “reported” and “clicked”.
- The industry score highlights the industry average score. If the industry average score is not known, the target score would be a good replacement.
Detect & Respond:
- The number of alerts detected, reviewed and investigated via the Security Operations Center (SOC), including the Median Time to Detect and Resolve.
- The number of major incidents detected (hopefully zero). A major incident can be considered an unauthorized occurrence on or conducted through an information system that jeopardises the confidentiality, integrity, or availability of the information system or any information residing therein.
Risks:
- The top three risk vectors (including the primary rationale) and the risk status of critical assets.
Each section includes a Red, Amber, Green (RAG) status, which can be used to help focus the discussion.
The iconography used as part of the “Priorities” and “Risks” sections can be updated as needed, with the colour (RAG) highlighting a sub-status.
I won’t claim this to be the perfect cybersecurity dashboard. However, I believe it does a good job of highlighting key information in a simple to consume format.
The most important thing is for the dashboard to facilitate a robust discussion with the Executive Committee and Board of Directors.
